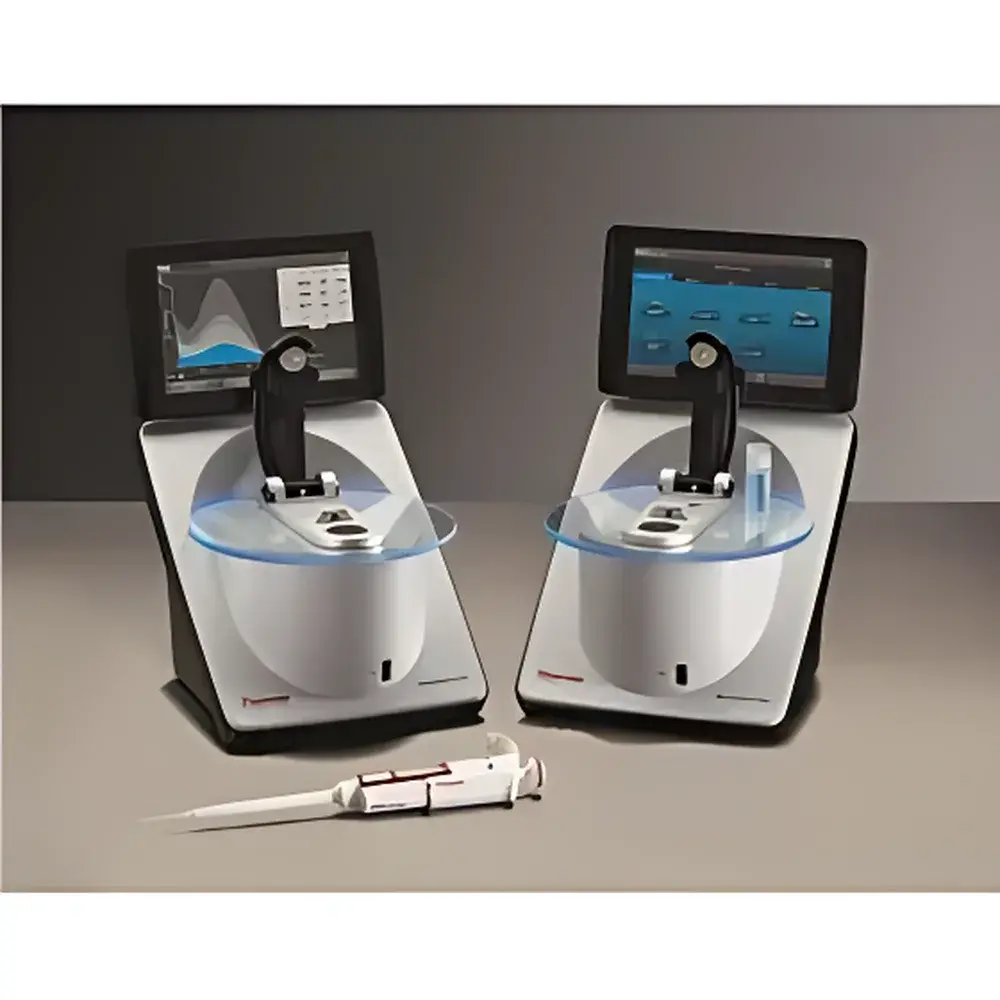
Thermo Scientific NanoDrop™ One Microvolume UV-Vis Spectrophotometer
| Origin | USA |
|---|---|
| Manufacturer Type | Authorized Distributor |
| Origin Category | Imported |
| Model | NanoDrop™ One |
| Price | USD 16,500 (FOB) |
Overview
The Thermo Scientific NanoDrop™ One Microvolume UV-Vis Spectrophotometer is an integrated, benchtop microvolume spectrophotometer engineered for rapid, accurate quantification and quality assessment of nucleic acids, proteins, and other UV-absorbing analytes. It operates on the principle of surface tension–mediated sample retention—where a minimal volume (1–2 µL) is suspended between two optical surfaces—and employs a high-resolution CCD array detector with a spectral range of 190–850 nm. Unlike conventional cuvette-based systems requiring dilution or large sample volumes, the NanoDrop One utilizes patented variable pathlength technology (U.S. Pat. Nos. 6,628,382 and 6,809,826) to dynamically adjust optical pathlength from 0.05 mm to 1.0 mm, enabling direct measurement of highly concentrated samples without manual dilution. This architecture eliminates pipetting errors, reduces reagent consumption, and accelerates decision-making in molecular biology workflows—particularly prior to downstream applications such as NGS library preparation, qPCR, or recombinant protein expression.
Key Features
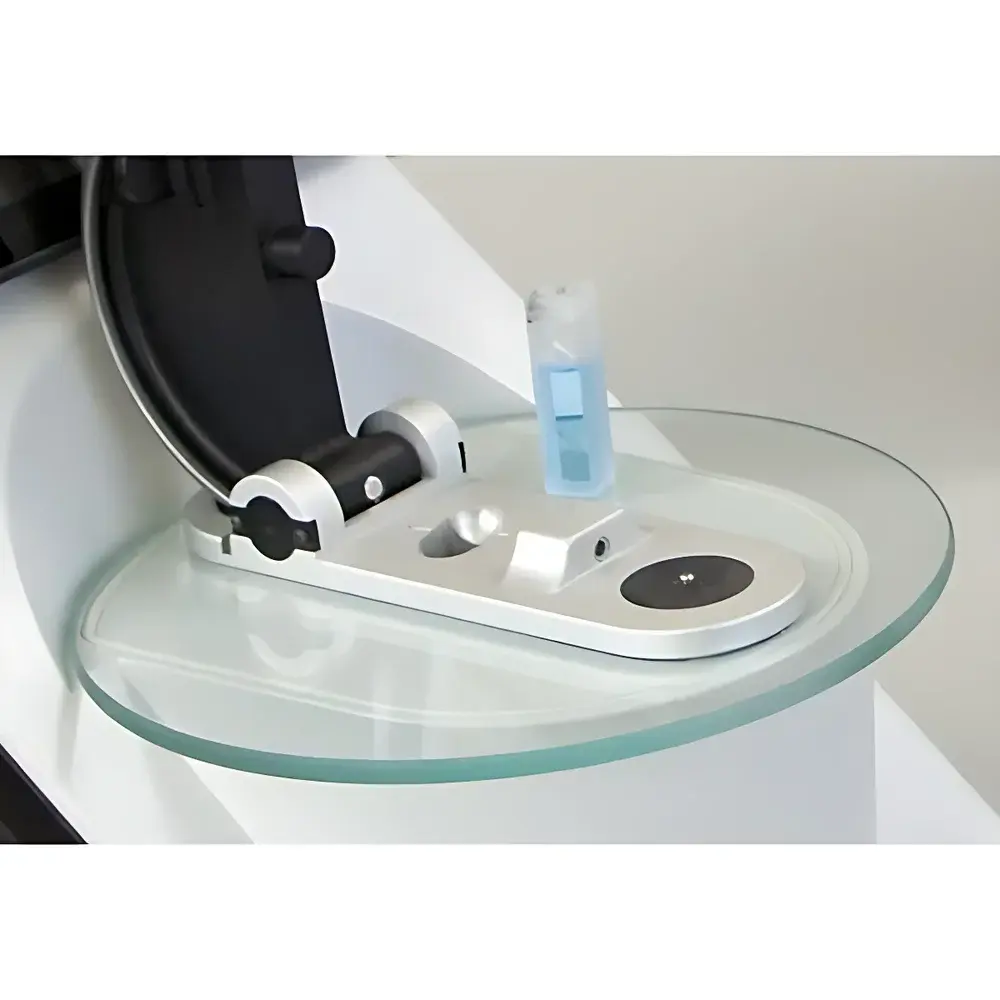
- Microvolume analysis with 1–2 µL sample requirement—no cuvette loading or capillary handling
- Automated pathlength adjustment (0.05–1.0 mm) supporting dsDNA concentrations up to 27,500 ng/µL and BSA up to 820 mg/mL
- Integrated Acclaro Sample Intelligence technology: real-time spectral deconvolution to detect common contaminants (e.g., guanidine, phenol, EDTA, carbohydrates) and deliver corrected concentration values
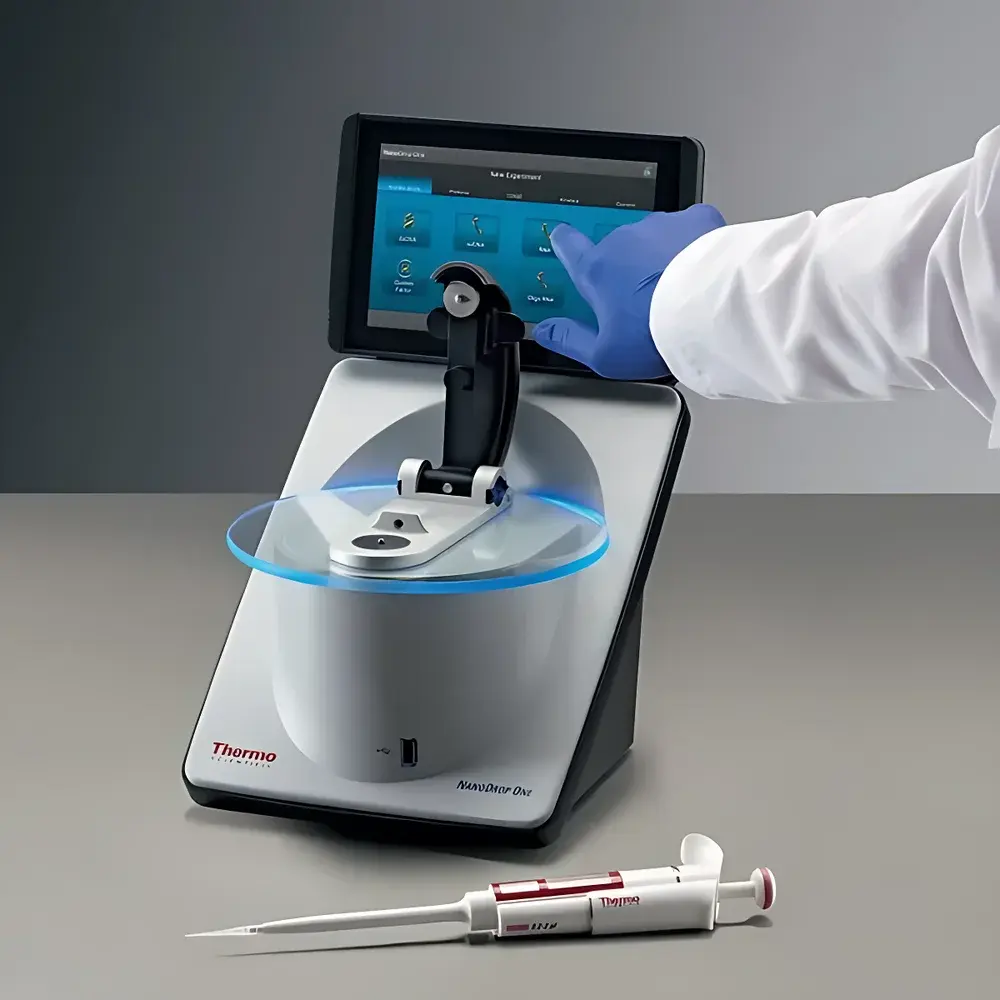
- Touchscreen Android™ interface with embedded learning center—access archived application notes, video tutorials, and troubleshooting guides without external PC
- Auto-measure and auto-zero functions activated by lowering the measurement arm—streamlining multi-sample throughput
- Full-spectrum acquisition (1 nm resolution) with preconfigured methods for DNA (260 nm), RNA, protein A280, BCA (562 nm), Bradford (595 nm), Lowry (650 nm), Pierce 660 (660 nm), OD600, and gold nanoparticles (520 nm)
- Embedded digital imaging and sensor fusion for measurement integrity validation and audit-ready traceability
Sample Compatibility & Compliance
The NanoDrop One supports both pedestal-based microvolume measurements and optional cuvette-based analysis (NanoDrop OneC model). Cuvette mode includes temperature-controlled (20–40 °C) and stirring capabilities for kinetic assays and bacterial culture density monitoring (OD600). All measurements comply with standard analytical practices referenced in ISO 17025–accredited laboratories. While designated “For Research Use Only”, the system’s data integrity features—including timestamped measurement logs, user authentication, and non-editable raw spectral files—align with GLP documentation requirements. Exported data formats (CSV, PDF, XML) support integration into LIMS environments, and instrument connectivity (Wi-Fi, Ethernet, USB) facilitates adherence to internal SOPs governing electronic record retention per FDA 21 CFR Part 11 where applicable.
Software & Data Management
Data acquisition, visualization, and reporting are managed through the embedded Android OS and synchronized via Thermo Fisher Cloud. Users can export spectra and concentration reports directly to USB drives, network printers (via Wi-Fi/Ethernet/USB), or cloud storage. The NanoDrop One/OneC PC Viewer software enables post-acquisition analysis—including overlay of multiple spectra, baseline correction, and custom ratio calculations (A260/A280, A260/A230). Cloud-based collaboration allows secure cross-laboratory data sharing across registered accounts, with role-based access control. All exported files retain original metadata (instrument ID, operator, date/time, method parameters), satisfying traceability requirements for method validation and internal audits.
Applications
- Quantitative and qualitative assessment of genomic DNA, plasmid DNA, total RNA, and mRNA prior to sequencing or reverse transcription
- Routine QC of purified recombinant proteins and antibody preparations using A280, extinction coefficient, or colorimetric assays
- Detection of residual contaminants in nucleic acid isolations—enabling early intervention before costly downstream failures
- Monitoring of cell culture growth kinetics via OD600 in cuvette mode (OneC)
- Characterization of nanomaterials including gold nanoparticles (520 nm), quantum dots, and dye-conjugated probes
- Validation of oligonucleotide synthesis yield and purity (260/280 and 260/230 ratios)
FAQ
Does the NanoDrop One require routine calibration with standards?
No—each instrument undergoes factory calibration against NIST-traceable reference materials. Wavelength accuracy is maintained via internal holmium oxide and didymium filters; absorbance linearity is verified across the full dynamic range using neutral density filters. User verification protocols are available in the embedded learning center.
Can I perform kinetic measurements on the NanoDrop One?
Kinetic analysis is supported only in cuvette mode (NanoDrop OneC), which includes programmable temperature control (±0.5 °C) and magnetic stirring. Microvolume pedestal mode captures single-point spectra only.
Is data export compliant with laboratory information management systems (LIMS)?
Yes—CSV and XML exports contain structured metadata compatible with most LIMS ingestion pipelines. Instrument-generated PDF reports include QR-coded links to cloud-stored raw data for audit trail reconstruction.
What regulatory frameworks does the NanoDrop One support?
While not intended for clinical diagnostics, its data governance features—including immutable measurement logs, user authentication, and electronic signature readiness—support alignment with GLP, GMP, and 21 CFR Part 11 principles in research and development environments.
How does Acclaro technology improve measurement confidence?
Acclaro applies multivariate spectral modeling to identify and quantify common organic and inorganic contaminants in real time. It then applies algorithmic correction to reported concentrations and flags spectral anomalies—reducing reliance on subjective interpretation of A260/A280 or A260/A230 thresholds alone.
Related Products

")