Fluxim OLED/PeLED Electroluminescence and Photoluminescence Measurement System
| Brand | Fluxim |
|---|---|
| Origin | Switzerland |
| Model | OLED/PeLED |
| Angular Range | −90° to +90° |
| Spectral Range | 360–1100 nm |
| Spectral Resolution | 2.5 nm |
| Signal-to-Noise Ratio | 300:1 |
| Voltage Range | ±20 V |
| Current Range | ±120 mA |
| Current Resolution | <100 pA |
| Polarizer Rotation | 0–360° (continuous) |
| Sample Stage | 40 × 40 mm² |
| PL Excitation Wavelength | 275–405 nm (default 365 nm) |
| PL Spot Size | 5 × 3 mm² |
| Dimensions | 50 × 29 × 24 cm³ |
| Weight | 18 kg |
Overview
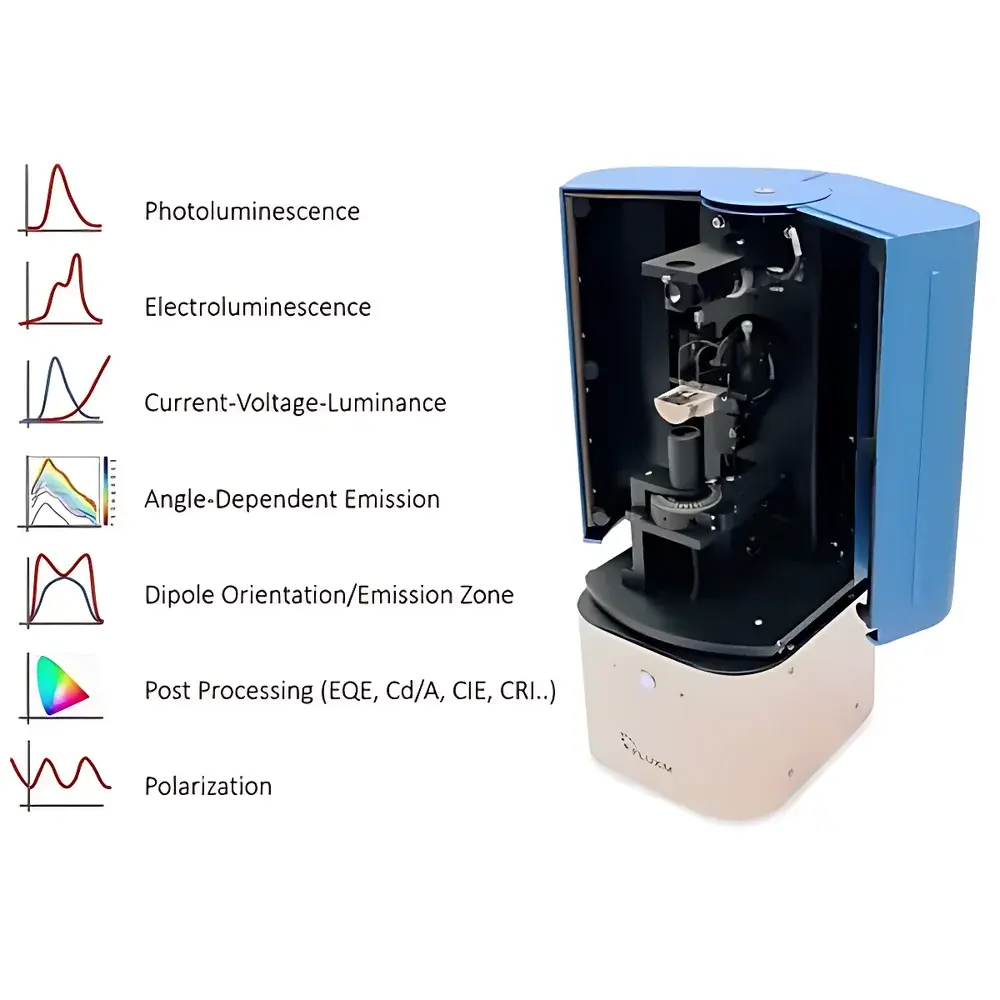
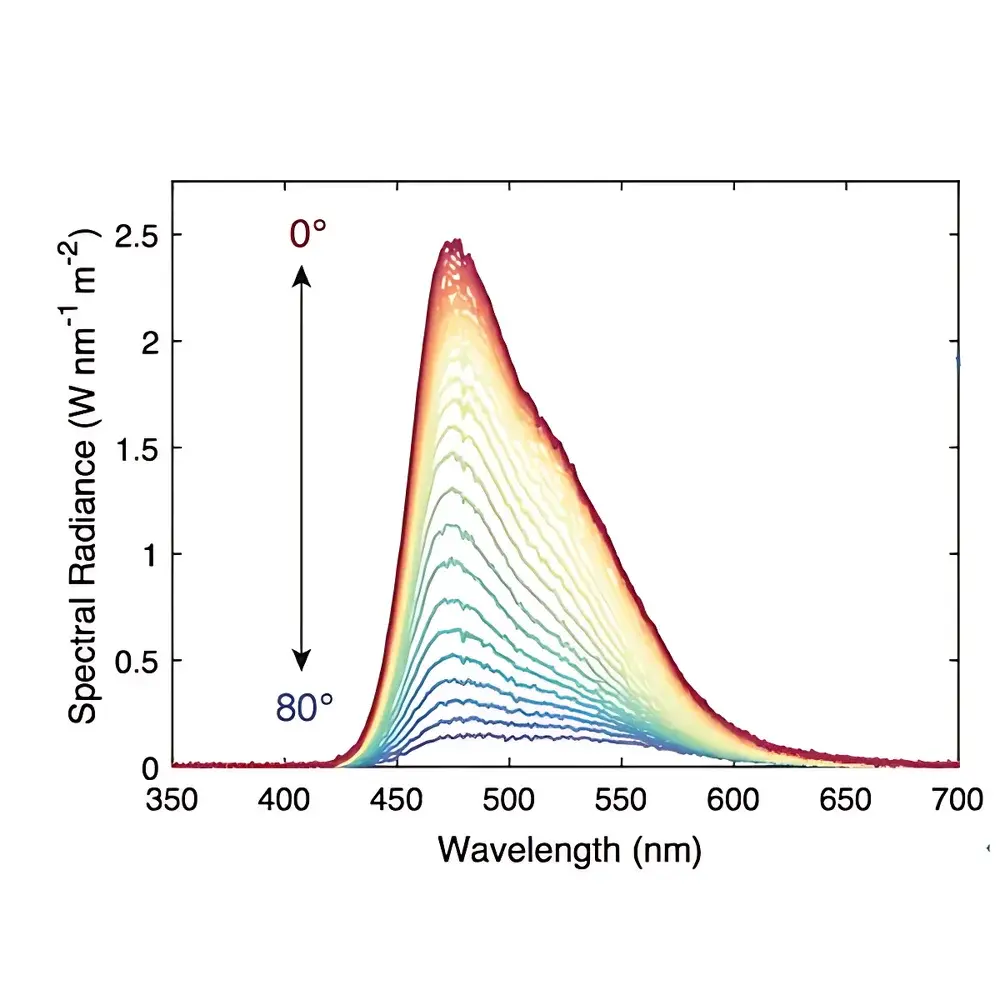
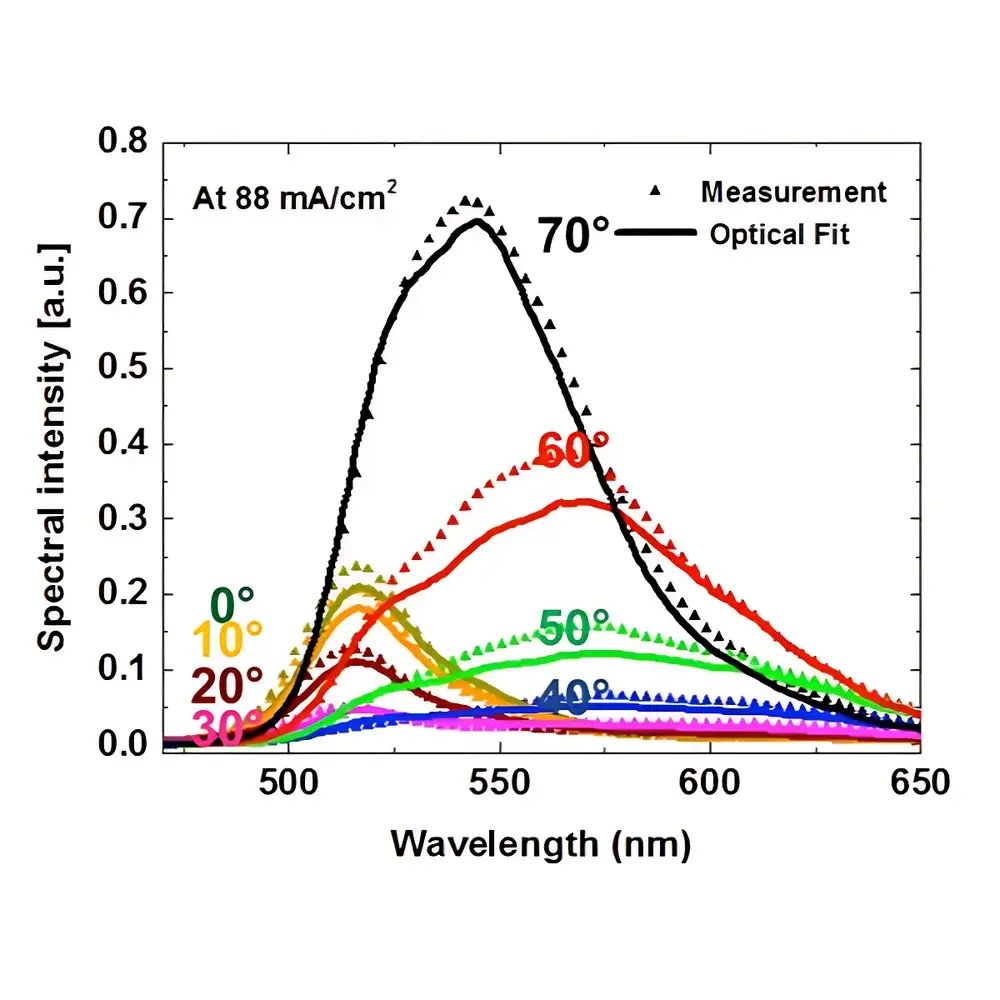
The Fluxim OLED/PeLED Electroluminescence and Photoluminescence Measurement System is a high-precision, modular optical characterization platform engineered for quantitative angular-resolved spectroscopy of emissive organic and perovskite light-emitting devices. Based on calibrated goniometric photometry combined with double-monochromator spectroradiometry, the system enables rigorous determination of electroluminescent (EL) and photoluminescent (PL) spectral radiance, luminance, chromaticity, and quantum efficiencies as functions of emission angle and polarization state. Its core architecture supports both top- and bottom-emitting device architectures—critical for modern stacked OLEDs, PeLEDs, and microcavity-integrated emitters—while maintaining traceable photometric calibration against NIST-traceable standards. The system operates under controlled environmental conditions (optional temperature-stabilized sample chamber available), ensuring reproducibility required for R&D process optimization and pre-fabrication yield forecasting.
Key Features
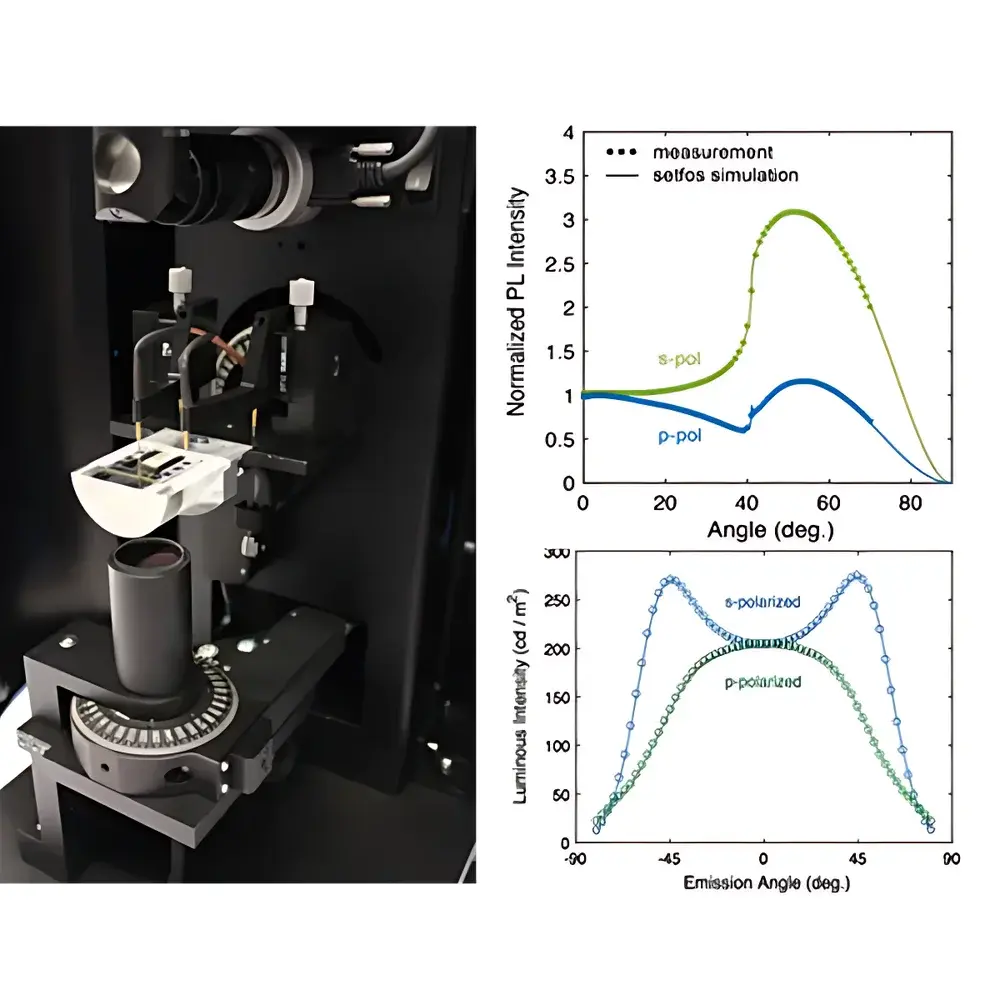
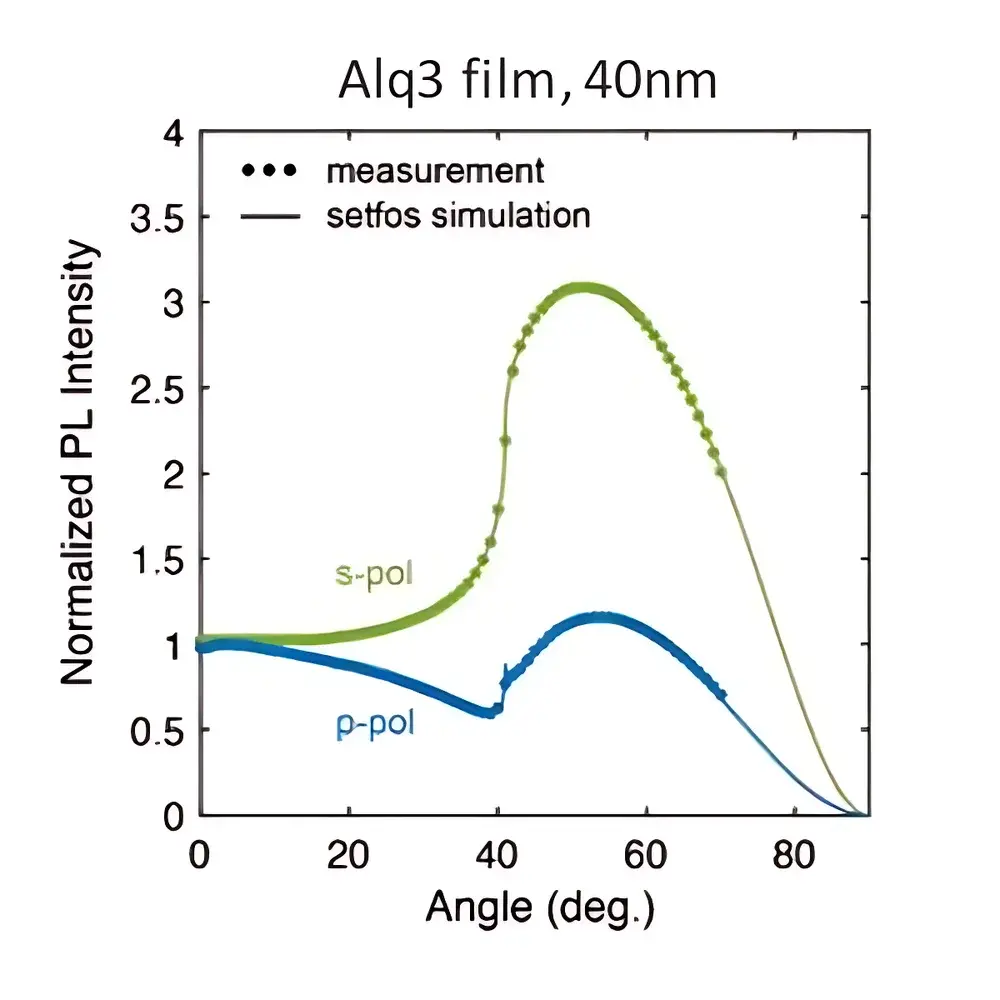
- Full hemispherical angular scanning from −90° to +90° with angular resolution better than 0.5°, enabling precise extraction of dipole orientation distribution in emissive layers
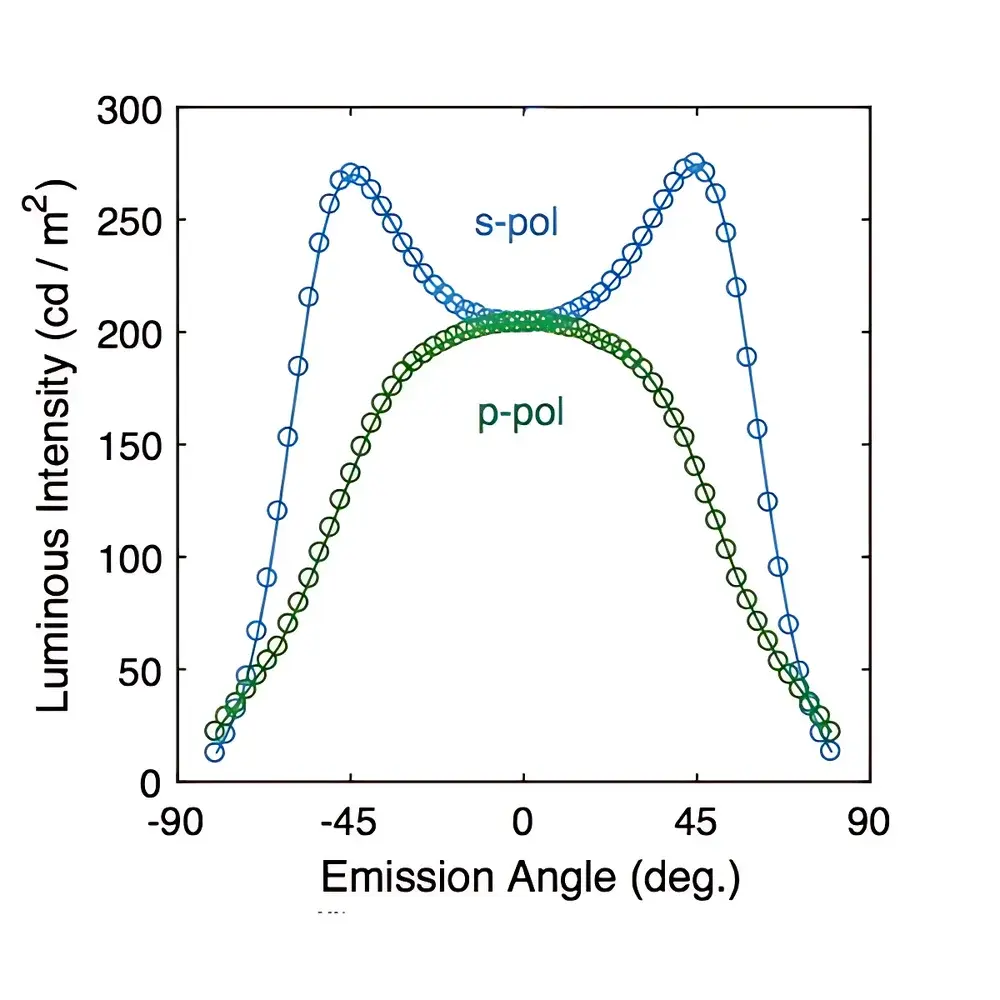
- Simultaneous p- and s-polarization detection via motorized rotating polarizer (0–360° continuous rotation), supporting Mueller matrix-derived polarization analysis
- Integrated dual-mode excitation: DC/AC voltage biasing for EL characterization and tunable UV–violet LED source (275–405 nm, default 365 nm) for PL mapping
- High-dynamic-range current–voltage–luminance (J–V–L) acquisition with sub-100 pA current resolution and ±20 V compliance voltage
- Spectroradiometric calibration across 360–1100 nm with 2.5 nm optical resolution and SNR ≥ 300:1 (at 1 s integration)
- Automated sample alignment routine with real-time centroid tracking and active focus compensation
- Modular design accommodating custom substrates up to 40 × 40 mm², including flexible, glass, and encapsulated test chips
Sample Compatibility & Compliance
The system is validated for use with standard ITO/glass, Ag-grid anodes, inverted OLED stacks, solution-processed PeLEDs, and hybrid perovskite thin-film devices. It complies with ISO/CIE photometric measurement protocols (CIE S 025/E:2015, CIE 127:2007) and supports GLP-compliant data acquisition through audit-trail-enabled software logging. All spectral irradiance and radiance outputs are referenced to SI-traceable calibrations performed annually by an accredited metrology laboratory. Device-level reporting conforms to ASTM D7912–19 (Standard Practice for Measuring External Quantum Efficiency of Organic Light-Emitting Diodes) and IEC 62341-6-2 (OLED display measurement standards). Optional integration with environmental control modules satisfies requirements for humidity- and temperature-dependent stability testing per JEDEC JESD22-A110.
Software & Data Management
Control and analysis are executed via Fluxim’s proprietary SpectraView Suite v4.x—a Windows-based application compliant with FDA 21 CFR Part 11 for electronic records and signatures. The software provides synchronized acquisition of spectral, angular, polarization, and electrical parameters; batch processing of multi-angle datasets; and automated generation of EQE, luminous efficacy (lm/W), luminance efficiency (cd/A), CIE 1931 xy coordinates, CCT, CRI, and viewing-angle-dependent color shift maps. Raw data is stored in HDF5 format with embedded metadata (wavelength, angle, polarization, timestamp, instrument configuration), ensuring FAIR (Findable, Accessible, Interoperable, Reusable) principles. Export options include CSV, MATLAB .mat, and industry-standard DIAS-compatible formats for integration into TCAD or optical simulation workflows (e.g., SETF, FDTD, ray-tracing).
Applications
- Quantitative dipole orientation analysis in thermally activated delayed fluorescence (TADF) and hyperfluorescence emitter systems
- Angular-dependent outcoupling efficiency modeling for microcavity OLEDs and nanostructured electrodes
- PL quantum yield mapping of perovskite precursor films and post-annealing homogeneity assessment
- EL degradation kinetics under constant-current stress, correlated with spectral blue-shift and angular narrowing
- Validation of optical simulation outputs (e.g., transfer-matrix method, finite-difference time-domain) using experimental angular PL/EL datasets
- Pre-manufacturing qualification of emissive layer uniformity and interfacial defect density via spatially resolved polarization-resolved PL
FAQ
What types of device architectures does this system support?
It accommodates both top-emitting and bottom-emitting configurations, including transparent cathode stacks, semi-transparent anodes, and tandem device structures.
Can the system measure external quantum efficiency (EQE) without absolute calibration standards?
No—EQE calculation requires absolute spectral radiance calibration using a NIST-traceable reference lamp; this calibration is included with initial installation and recommended annually.
Is the PL excitation source tunable across the full 275–405 nm range?
Yes, the integrated LED array supports discrete wavelength selection at 275, 310, 365, and 405 nm; continuous tuning requires optional monochromator-coupled laser source.
Does the software support automated batch measurement of multiple samples?
Yes—SpectraView Suite includes scriptable macro functionality and barcode-triggered measurement sequences for unattended operation across wafer-level test sites.
How is polarization data acquired and processed?
A motorized rotating polarizer is placed in the detection path; Stokes parameter fitting is applied to sequential intensity measurements at four or more angles to reconstruct the full polarization state at each emission angle and wavelength bin.
Related Products


")