Ocean Optics SpectrumTEQ-EQY-EL Electroluminescence Quantum Efficiency Measurement System
| Brand | Ocean Optics |
|---|---|
| Model | SpectrumTEQ-EQY-EL |
| Origin | Imported |
| Manufacturer Type | Manufacturer |
| Configuration Options | Integrated Enclosed Sphere (3.3″) or Probe-Station-Based (1.5″) |
| Measurement Capabilities | EQE, Luminance, CIE Chromaticity Coordinates, Dominant Wavelength, Radiant Flux, EQE vs. Current Density |
| Software Integration | TEQ Control Suite with Source Meter Synchronization |
| Compliance Support | ASTM E308, CIE 127, ISO/CIE 11664, GLP-relevant audit trail logging |
Overview
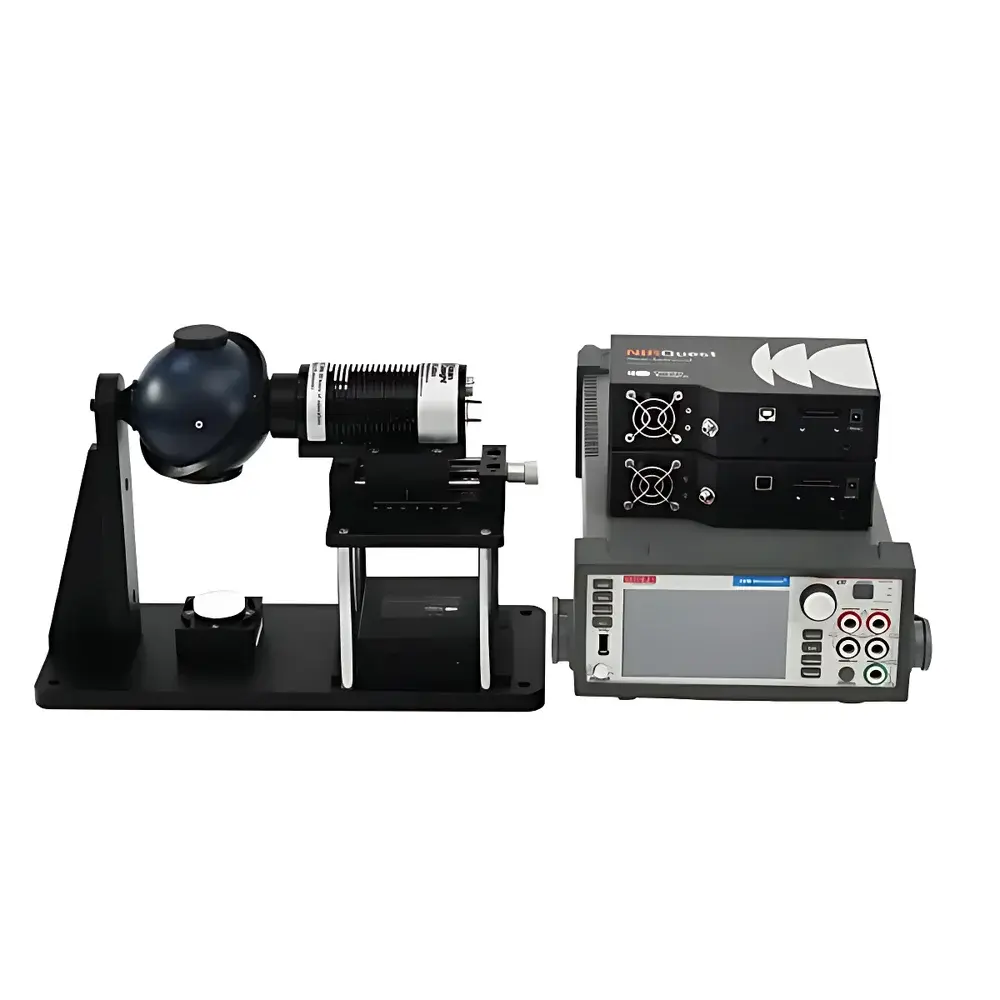
The Ocean Optics SpectrumTEQ-EQY-EL is a precision-engineered electroluminescence (EL) quantum efficiency measurement system designed for quantitative photometric and radiometric characterization of light-emitting devices under electrical excitation. Built upon the principles of absolute spectral radiance calibration and calibrated sphere-based photometry, the system determines external quantum efficiency (EQE) by synchronizing spectrally resolved emission data—acquired via a high-stability, back-thinned CCD spectrometer—with precisely controlled current–voltage sourcing. Unlike conventional EL testers relying on relative intensity scaling, the SpectrumTEQ-EQY-EL employs NIST-traceable calibration protocols to deliver traceable, reproducible EQE values expressed as photons emitted per electron injected (unitless %). Its modular architecture enables seamless integration into inert-atmosphere environments—including gloveboxes—supporting in situ characterization of air-sensitive OLEDs, PeLEDs, QD-LEDs, and inorganic thin-film EL devices during fabrication or aging studies.
Key Features
- Two interchangeable optical configurations: (1) an integrated 3.3-inch integrating sphere optimized for high-luminance devices (>100 cd/m²), featuring motorized shutter control and custom fixture interfaces; (2) a compact probe-station variant with 1.5-inch sphere, enabling localized single-point EL measurement on irregular, sub-millimeter, or flexible substrates.
- Full spectral acquisition range from 350 nm to 1000 nm with <0.1 nm pixel resolution, supporting CIE 1931 chromaticity calculations, dominant wavelength derivation, and radiant flux integration per IES LM-79 and CIE S 025/E:2015.
- Tight synchronization between the Ocean Insight QE Pro or FX spectrometer and programmable source measure units (SMUs) ensures accurate current-density–resolved EQE mapping, including transient EL response capture at user-defined pulse widths and duty cycles.
- Modular expandability: Optional PL excitation modules (365 nm/405 nm LEDs or tunable lasers) and fiber-coupled excitation optics allow conversion to dual-mode EL/PL quantum yield measurement without hardware replacement—only mechanical reconfiguration and software license activation required.
- Robust mechanical design with aluminum alloy housing, ESD-safe components, and low-outgassing materials certified for Class 1000 glovebox operation (O₂ < 0.1 ppm, H₂O < 0.1 ppm).
Sample Compatibility & Compliance
The SpectrumTEQ-EQY-EL accommodates rigid glass/ITO substrates, flexible PET/PEN-based devices, micro-LED arrays, and powder-based EL phosphors mounted on conductive carriers. Fixture adaptability supports standard device geometries (e.g., 5 mm × 5 mm active area) as well as nonstandard layouts via CNC-machined, gold-plated contact plates with spring-loaded pogo pins. All optical calibrations adhere to ASTM E308-23 (computing colorimetric quantities from spectral data) and CIE 127:2007 (conditions for LED intensity measurement). System software maintains full audit trails compliant with GLP and FDA 21 CFR Part 11 requirements when paired with validated SMU drivers and digital signature-enabled report generation.
Software & Data Management
The TEQ Control Suite provides a unified interface for instrument orchestration, real-time spectral visualization, automated EQE computation, and multi-parameter export (CSV, HDF5, .xlsx). It implements ISO/IEC 17025-aligned uncertainty propagation models based on spectrometer SNR, sphere throughput variability, and SMU accuracy specifications. Batch processing supports time-series EQE monitoring across thermal or operational stress conditions. Raw spectral files are stored with embedded metadata—including calibration timestamps, integration times, grating positions, and environmental sensor logs (optional temperature/humidity monitoring)—ensuring full experimental traceability.
Applications
- Development and qualification of solution-processed OLED emitters and host–guest systems
- Efficiency benchmarking of perovskite light-emitting diodes (PeLEDs) under inert atmosphere
- Quantitative comparison of triplet harvesting mechanisms in TADF and hyperfluorescence architectures
- Stability assessment of EL quantum yield degradation kinetics under constant-current stress
- Correlation of EL spectra with photoluminescence (PL) quantum yield to evaluate charge balance and exciton confinement
- Pre-certification testing aligned with IEC 62341-6-1 (OLED display luminance uniformity and efficiency)
FAQ
Can the system measure absolute EQE without external reference standards?
Yes—the system performs absolute EQE calculation using factory-applied sphere throughput calibration and spectrometer radiometric calibration traceable to NIST SRM 2031 and 2032.
Is glovebox integration limited to nitrogen environments?
No—compatible with argon, nitrogen, or mixed-gas gloveboxes; all internal optics and electronics meet ASTM D4295 outgassing limits for ultra-low moisture applications.
Does the software support custom scripting for automated test sequences?
Yes—Python API access is provided via the OceanInsight SDK, enabling integration with LabVIEW, MATLAB, or custom CI/CD pipelines for high-throughput screening.
How is current density calculated for non-uniform devices?
Users define active area geometry in the software; current density is computed as total drive current divided by user-specified emissive area, with optional mask-based ROI selection for spatially resolved analysis.
Can the same calibration be used after switching between EL and PL modes?
No—separate radiometric calibrations are required for each excitation path due to differences in optical throughput and stray light contributions; the software manages distinct calibration profiles automatically.